Overview
The Memory API provides an interactive graph visualization tool that lets you explore your knowledge graph visually. See entities, relationships, and how your data is connected. Visualization URL: https://memory.stru.ai/graph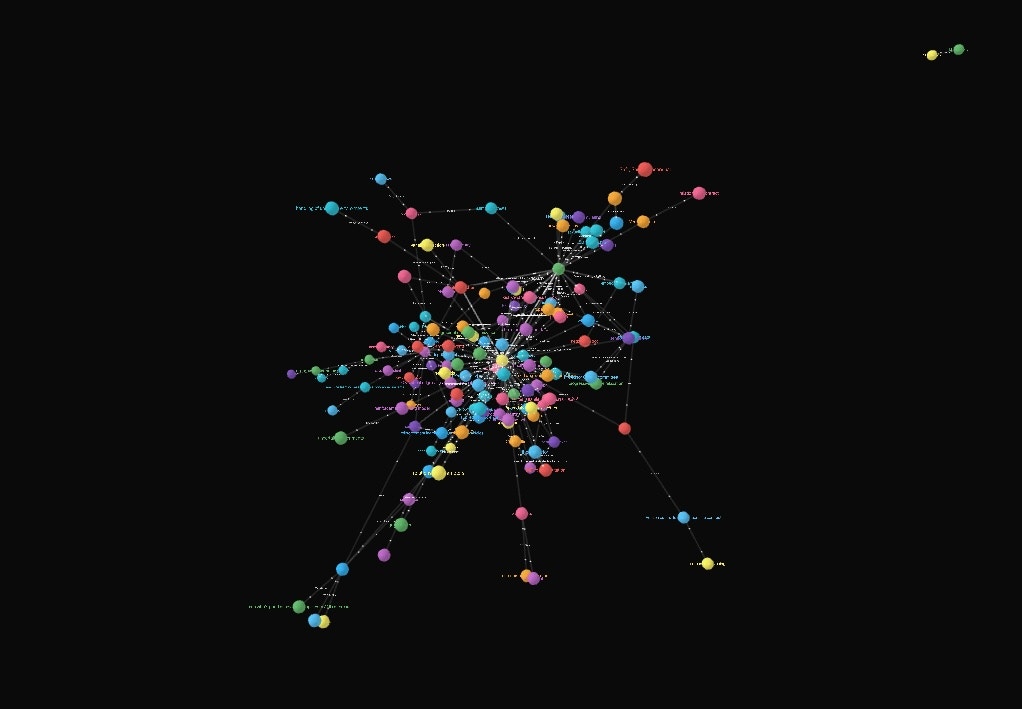
Accessing the Visualization
Simply navigate to the visualization URL in your browser:The graph visualization is interactive and allows you to explore your knowledge graph, see entity relationships, and understand how information is connected.
What You’ll See
The visualization displays:Entity Nodes
Visual representations of entities in your knowledge graph (people, places, concepts, objects)
Relationship Edges
Connections between entities showing relationships like “USES”, “LOCATED_IN”, “HAS_CONCERN”
Graph Structure
The overall structure of your knowledge graph and how entities cluster together
Interactive Exploration
Click and drag to explore, zoom in/out, and interact with the graph
Use Cases
Debug Knowledge Extraction
Debug Knowledge Extraction
Verify that entities and relationships are being extracted correctly from your episodes. See if the knowledge graph matches your expectations.
Understand User Context
Understand User Context
Visualize what information the system knows about a user and how different pieces of knowledge are connected.
Quality Assurance
Quality Assurance
Check the quality of your knowledge graph before deploying to production. Identify incorrect relationships or missing entities.
Explore Relationships
Explore Relationships
Discover unexpected connections between entities and understand how information relates across conversations.
Features
Interactive Navigation
- Pan: Click and drag to move around the graph
- Zoom: Scroll to zoom in/out on specific areas
- Click Nodes: Click on entities to see details
Visual Hierarchy
- Different node types have different visual styles
- Relationship types are labeled on edges
- Related entities cluster together
Real-time Updates
- The graph updates as you add new episodes
- Changes to the knowledge graph are reflected in the visualization
Tips for Using the Visualization
Start with a specific user - Filter to a single group_id to avoid overwhelming visualizations
Look for clusters - Related entities naturally group together, making it easy to spot topics
Follow the edges - Relationship labels help you understand how entities are connected
Use the visualization during development to verify your knowledge graph is being built correctly before deploying to production.
Related Endpoints
If you need programmatic access to graph data:Get Entity Edge
Retrieve relationship edges for a specific entity programmatically
Entity Operations
Advanced operations for manually managing entities and edges
Example Workflow
1
Add Episodes
Add conversation episodes or data to the knowledge graph via the
/episodes endpoint2
Wait for Processing
Allow 1-5 minutes for knowledge extraction to complete
3
Open Visualization
Navigate to https://memory.stru.ai/graph in your browser
4
Explore Your Graph
Interact with the visualization to see entities, relationships, and knowledge structure
5
Verify Quality
Check that entities and relationships match your expectations